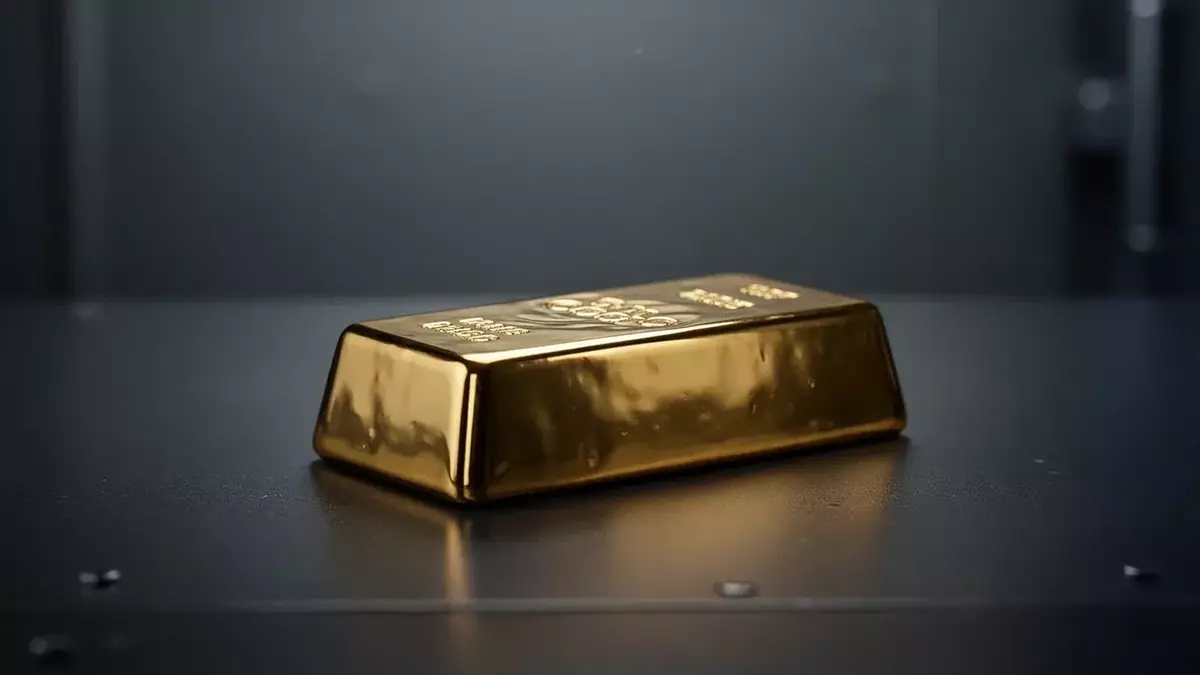
Gold at a Crossroads: Warsh's First Dot Plot Looms Over Record Sovereign Buying
Published on 06/15/2026 at 14:12 | Redaktion boerse-global.de
After clawing back to $4,359 an ounce — a roughly 3% advance from Friday’s close — gold has recouped some of its recent losses, but remains more than 22% below the January all-time high of $5,627. The real test, however, begins in Washington over the next 48 hours as the Federal Open Market Committee convenes for the first time under Chairman Kevin Warsh.
A Pause Priced In, but the Dot Plot is Everything
The June 16–17 meeting marks Warsh’s debut at the helm of the Fed, having taken office only at the end of May. Markets see a 97% probability of a rate hold, leaving the updated dot plot as the sole source of volatility. If the Fed removes the rate cut previously penciled in for 2026 — or pushes the first reduction entirely into 2027 — higher real yields would heap fresh pressure on bullion. Warsh’s policy leanings remain an unknown quantity, adding an extra layer of uncertainty for traders.
Inflation and the ECB Add to the Headwinds
The U.S. consumer price index came in at 4.2% in May, its highest since April 2023, driven by a 23.5% surge in energy costs linked to the Iran conflict. Core inflation held at 2.9%. Across the Atlantic, the European Central Bank raised its deposit rate from 2.00% to 2.25% on June 11 — the first hike since September 2023. Goldman Sachs promptly scrapped all forecasts for rate cuts in 2026, underscoring a broader tightening bias among major central banks.
Should investors sell immediately? Or is it worth buying Gold?
Physical demand metrics paint a starkly different picture. The World Gold Council reported first?quarter global gold demand of $193 billion, up 74% year?on?year, with bar and coin investment at 474 tonnes — the second?largest quarterly gain on record. Central banks added 244 tonnes net in Q1, the fastest pace in over a year, and in April net purchases of around 17 tonnes marked a sharp reversal from heavy selling in March. China’s central bank bought for the 19th consecutive month in May, while India saw $3.7 billion flow into gold ETFs during the first quarter — nearly six times the year?ago level. Wealthy individuals and retail investors now hold 42% of those Indian ETF assets, using the metal as a hedge against economic volatility.
Sovereign Demand Reshapes Reserve Allocations
The structural driver behind the buying spree is clear. According to the ECB’s annual report, gold made up 27% of global official reserves at the end of 2025, up from 20% a year earlier, while the share of U.S. Treasuries slipped to 22%. The catalyst was Washington’s 2022 decision to freeze Russian dollar reserves — gold carries no counterparty risk and cannot be sanctioned or seized.
Near?Term Direction Hinges on Warsh
The major investment banks maintain ambitious targets despite the policy headwinds. Goldman Sachs sees gold at $5,400, Morgan Stanley at $5,200, UBS at $5,500 and JPMorgan around $6,000 — implying upside of 25% to 44% from current levels. Whether those forecasts are achievable depends entirely on Wednesday’s dot plot. A signal that rate cuts remain on the table for 2026 could spur a rapid recovery; a hawkish hold might push prices toward the October 2025 lows near $3,900. For now, gold sits 28% higher on the year, but the next move belongs to Kevin Warsh.
Ad
Gold Stock: New Analysis - 15 June
Fresh Gold information released. What's the impact for investors? Our latest independent report examines recent figures and market trends.
Disclaimer regarding our articles: No investment advice, no buy or sell recommendation. Information on prices, companies, and markets is provided without guarantee; changes are possible at any time. Stock market transactions can lead to substantial losses. Our articles are created and reviewed in whole or in part automatically with the support of AI.