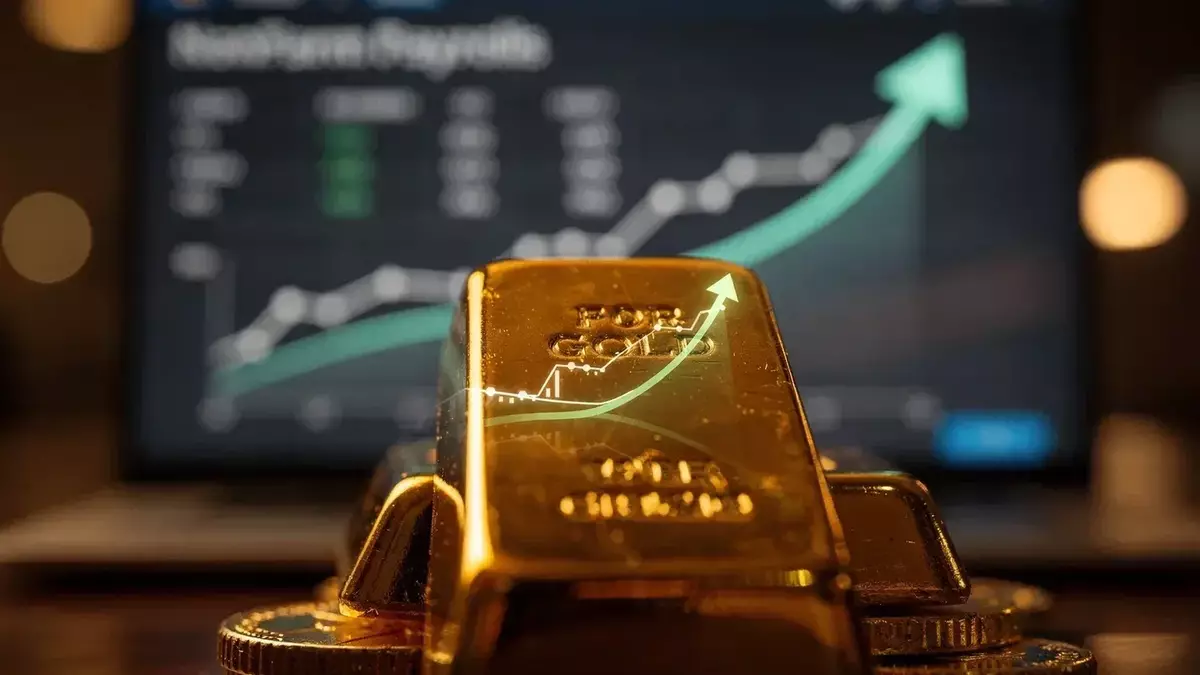
Gold’s Fragile Calm Faces a Defining Test on July 14 as Opposing Forces Cancel Out
Published on 07/11/2026 at 07:14 | Redaktion boerse-global.de
Gold is locked in a rare stalemate, caught between a weak US jobs market that argues for lower interest rates and a spike in oil prices that threatens to reignite inflation. The result is a precious metal trading almost flat at $4,118.80 per ounce, down 0.33% on Friday and 1.64% on the week. Since the start of the year, bullion has shed 5.14% of its value, a far cry from the January record of $5,626.80.
That record now looks distant. Gold sits 5.65% below its 50-day moving average of $4,365.31 and a steeper 9.26% below the 200-day moving average of $4,539.07. The Relative Strength Index stands at 43.4, pointing to neutral-to-soft momentum. Annualized volatility remains elevated at 27.01%, and the $4,000 mark — tested briefly in June — now looms as the key psychological floor.
The market’s competing forces are unusually stark. The June jobs report from the US showed only 57,000 new positions created, barely half the expected figure, while April and May data were revised down by a combined 74,000. Such weakness normally fuels expectations for Fed easing, which would benefit non-yielding gold. But the Federal Reserve’s latest minutes show policymakers remain wary of inflation, and no rapid loosening is in sight.
Complicating the picture is the renewed volatility in the Middle East. The ceasefire between the US and Iran collapsed on July 8, triggering a more than 7% surge in crude. Brent now trades around $77 a barrel, WTI near $73. Higher energy costs feed directly into inflation forecasts, giving the Fed more reason to keep rates elevated. Real yields on US Treasuries have climbed from 2.00% to 2.28% in recent sessions, raising the opportunity cost of holding gold.
Should investors sell immediately? Or is it worth buying Gold?
That tension is visible in the charts as well. While the metal holds above its 50-day exponential moving average — a short-term bullish signal — the weekly chart is flashing a head-and-shoulders pattern. Its neckline sits near $4,200, and a weekly close below that level could open the door to a deep slide toward the $2,575–$2,750 zone, according to chart analysts. To the upside, resistance clusters between $4,162 and $4,214.
Amid the noise, structural demand from central banks remains a steady anchor. Net sovereign purchases hit 41 tonnes in May, and analysts project full-year 2026 buying of around 850 tonnes — nearly double the pre-2022 average. The People’s Bank of China is also believed to have added to its reserves in June. This institutional appetite is largely immune to short-term rate speculation and provides a floor under prices.
Retail demand tells a different story. The high prices of recent months have dampened jewelry consumption in India and China, and the physical market is in a typical summer lull. Traders expect a seasonal pickup only in late summer, which could help gold break out of its sideways range.
Gold at a turning point? This analysis reveals what investors need to know now.
The institutional view offers some upside hope. Bernstein raised its 2026 target for gold to $4,533, citing resilient physical demand and limited selling pressure from gold-backed ETFs. Achieving that level would require gold to first hold the $4,000 support and then grind higher — a path that depends heavily on the direction of Treasury yields.
The next major catalyst arrives on July 14 with the US consumer price index. A softer-than-expected reading could ease the upward pressure on bond yields and allow gold to challenge the $4,162–$4,214 resistance zone. A sticky number, however, would reinforce the hawkish Fed narrative and likely push the metal back toward the $4,000 danger line. For now, gold remains suspended between two powerful currents — and the next big move will depend on which one breaks first.
Ad
Gold Stock: New Analysis - 11 July
Fresh Gold information released. What's the impact for investors? Our latest independent report examines recent figures and market trends.
Disclaimer regarding our articles: No investment advice, no buy or sell recommendation. Information on prices, companies, and markets is provided without guarantee; changes are possible at any time. Stock market transactions can lead to substantial losses. Our articles are created and reviewed in whole or in part automatically with the support of AI.