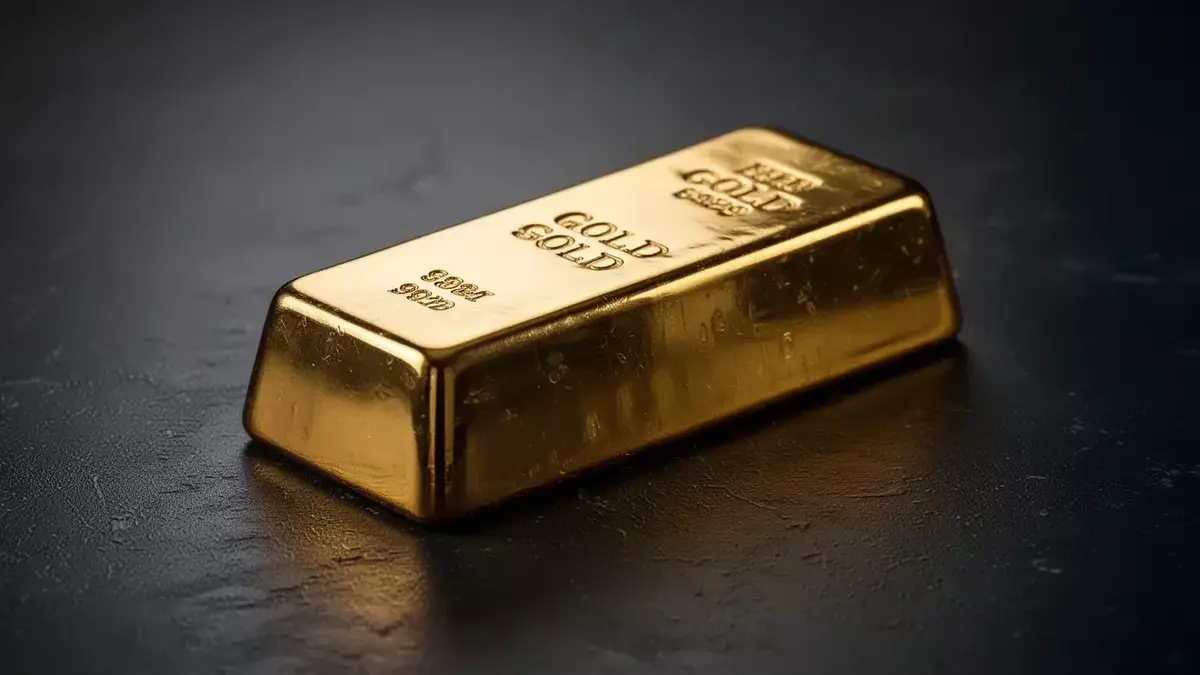
Gold's Technical Slide Below $4,100 Masks a Raging Battle Between Central Bank Demand and Rate Fears
Published on 07/13/2026 at 08:25 | Redaktion boerse-global.de
Gold opened the trading week on the back foot, shedding 1.5% on Monday to trade at $4,059.80 an ounce after closing Friday at $4,127.60. The decline pushed the yellow metal decisively under the psychologically important $4,100 threshold, a level that has acted as both a magnet and a barrier in recent sessions. The trigger was a fresh escalation in the Middle East — the fourth U.S. airstrike against Iranian targets inside a week, followed by Tehran's announcement that it would close the Strait of Hormuz indefinitely. Brent crude surged toward $100 a barrel, reigniting fears of an inflationary shock that could force central banks to keep monetary policy tight.
Ironically, the very geopolitical turmoil that would normally send investors rushing into gold is now acting as a headwind. The reasoning is straightforward: an oil-driven spike in consumer prices could compel the Federal Reserve to raise rates further, and gold — which offers no yield — becomes less attractive when real yields are rising and the dollar strengthens. Traders are currently pricing in a 58% to 62% probability of a rate hike at the Fed's September 2026 meeting, with hawkish whispers from within the central bank's June meeting minutes still fresh. Some Fed officials had even favored a move higher before ultimately holding steady.
The price action stands in stark contrast to what is happening beneath the surface. Central banks are buying gold at a pace rarely seen in modern history. China's People's Bank of China added roughly 480,000 troy ounces (around 15 metric tonnes) to its reserves in June, marking the 20th consecutive month of accumulation — the largest monthly purchase since October 2023. Poland remains the most aggressive buyer globally in 2025, while Uzbekistan has added 16.5 tonnes, Kazakhstan 6.5 tonnes, and the Czech Republic 3.4 tonnes so far in 2026. A World Gold Council survey of 74 central banks revealed that 45% intend to increase their gold holdings over the next twelve months, the highest percentage since the survey began in 2018. Only one institution plans to reduce its reserves.
Should investors sell immediately? Or is it worth buying Gold?
This structural demand, however, is being overwhelmed by macro forces. The technical picture has deteriorated markedly. On a weekly basis gold is down 1.18%; month-over-month the decline is 2.64%; and year-to-date the loss stands at 4.93%. The RSI sits at 44, a neutral-to-weak reading that offers no clear directional signal. The 52-week high of $5,626.80, set on January 29, 2026, now lies 26.64% above the current price, while the 52-week low of $3,901.30 from October 28, 2025 is only 5.80% away. Gold is currently trading 5.45% below its 50-day moving average of $4,365.48 and 9.07% below its 200-day average — a configuration that typically signals sustained selling pressure.
Regional demand patterns are equally mixed. In India, persistent volatility and elevated local prices have suppressed appetite; dealers have been forced to offer discounts of up to $19 an ounce against official domestic rates. Chinese demand, by contrast, remains steady. Institutional holdings in London vaults edged up 0.21% in May to 9,392 tonnes, while major banks like HSBC have trimmed their near-term price forecasts — though they maintain a constructive medium-term view on the back of central bank buying.
Chart watchers are now focused on the next support zones near $4,018 and the psychologically charged level of $3,960. A sustained break below those areas would open the door to a deeper correction toward $3,870. On the upside, the $4,159 region represents the nearest resistance; only a decisive move above that level would signal that a base is forming. For now, gold is caught between two powerful and opposing currents — a relentless wave of sovereign buying that provides a floor, and a tide of rate-hike and dollar strength that keeps pulling prices lower. Until one of these forces clearly dominates, the consolidation is likely to persist.
Ad
Gold Stock: New Analysis - 13 July
Fresh Gold information released. What's the impact for investors? Our latest independent report examines recent figures and market trends.
Disclaimer regarding our articles: No investment advice, no buy or sell recommendation. Information on prices, companies, and markets is provided without guarantee; changes are possible at any time. Stock market transactions can lead to substantial losses. Our articles are created and reviewed in whole or in part automatically with the support of AI.