
Silver’s $68 Tightrope: A 24% Monthly Plunge Masks a Structural Supply Gap as the Fed’s Dot Plots Loom
14.06.2026 - 13:37:33 | boerse-global.de
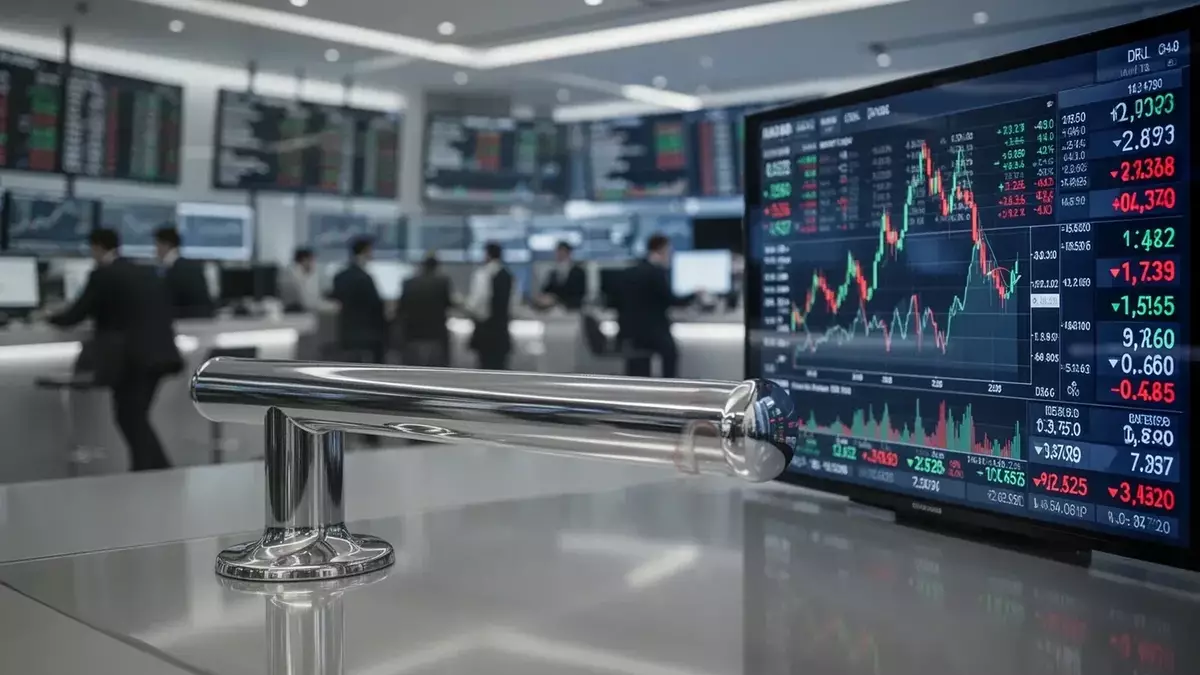
The white metal ended last week at $68.13 an ounce, nursing a 24% loss over the prior 30 days that has dragged it 44% below the January peak of $121.78. Yet beneath the price rout, industrial buyers are consuming silver at a record clip — a disconnect that underscores just how much short-term macro forces have overwhelmed long-term fundamentals. Wednesday’s Federal Reserve decision will determine whether the metal careens toward $54 or finds a footing near $80.
On the macro front, the European Central Bank already fired its opening shot, lifting all key rates by 25 basis points and pushing the deposit rate to 2.25% amid persistent inflation. This week the spotlight shifts to Washington, where Kevin Warsh presides over his first Fed meeting. No rate change is expected, but the quarterly “dot plot” projections on growth, inflation and the rate path will be the real market mover. Goldman Sachs sees the first cut arriving only by mid-2027, a timetable that keeps real yields elevated. Ten-year U.S. Treasury yields are hovering near 4.5%, a level that sucks capital away from non-yielding assets like silver, while the dollar index recently failed to breach 100, offering limited relief.
The interest-rate headwind has hit silver harder than its precious-metal peer. Over the past month, the gold-silver ratio has surged to 63, meaning silver has lost double the ground gold has. If the Fed’s dot plots lean hawkish, analysts expect a swift move toward the $54 support zone; a dovish surprise could spark a recovery to the $80 area. The RSI stands at 40.7, indicating room to fall further but no clear floor yet.
Should investors sell immediately? Or is it worth buying Silber Preis?
Meanwhile, the supply picture tells a completely different story. Global mine production has failed to keep pace with demand for the sixth consecutive year, and the deficit is widening. The solar industry alone will consume as much as 125 million ounces this year, electric-vehicle production another 75 million ounces, and the build-out of AI data centers a growing share for thermal management and precision contacts. Silver is largely a by-product of copper and zinc mining, so producers cannot simply ramp up output to meet the surge. That structural shortfall should, in theory, underpin prices — but it has been powerless against the gravitational pull of higher yields.
Chart-wise, silver is testing a resistance zone after Friday’s close left it roughly 10% below its 50-day moving average of about $76. A clean breakout could target the $72 area, the next upside marker, but a hawkish Fed tone could trigger a fast reversal toward the $54 support that has held in previous downturns. With annualized volatility near 61%, the market is primed to swing sharply in either direction once the central bank’s message lands.
For now, the metal is caught between a fundamental floor and a monetary ceiling. Wednesday’s dot plots will decide which side cracks first.
Ad
Silber Preis Stock: New Analysis - 14 June
Fresh Silber Preis information released. What's the impact for investors? Our latest independent report examines recent figures and market trends.